
Yearly statistics
| Platform | Status | Where |
|---|---|---|
| iOS | done | vulture-ios/Packages/FlightScreens/Sources/FlightScreens/Statisticsvulture-ios/Packages/FlightScreens/Sources/FlightScreens/Hosting/Statistics |
| Android | done | vulture-android/feature/statisticsvulture-android/domain/logbookFIXED(B10) rounding, FIXED(B14) single-year grid corners. |
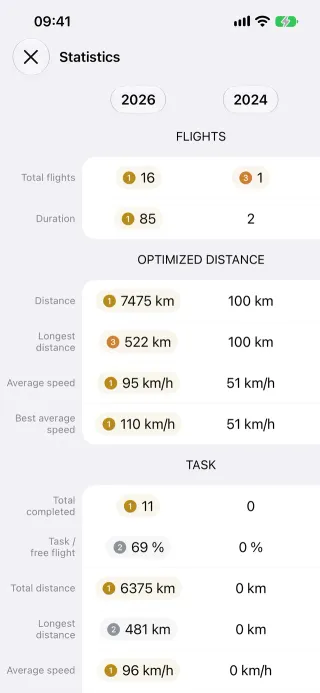
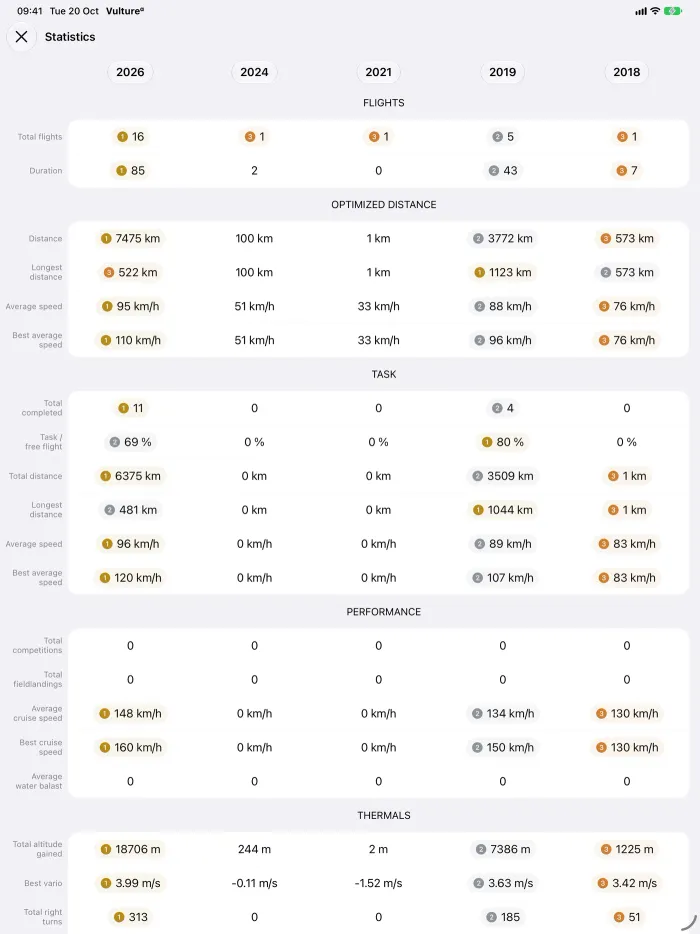
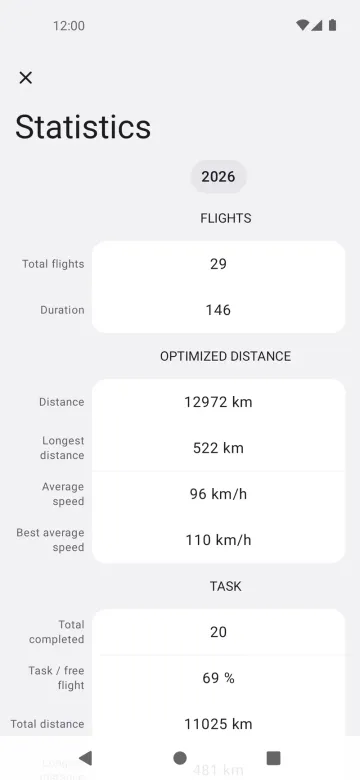
Behaviour
Section titled “Behaviour”- A grid of the logbook’s totals per year: number of flights, hours, distance, speed and the like.
- Needs Vulture Pro (
statistics); without it the paywall opens.
Platform differences
Section titled “Platform differences”- Units are converted before rounding (B10) and the grid corners are right for a single year (B14) on both platforms; iOS has caught up with Android.
- The Thermals group’s “Total altitude” sums each flight’s height gained in thermals (stored as
thermalAltitudeGained), on both platforms since the calculation fixes (2026-10-20). Before, it summed each flight’s largest single climb. Android fills old flights by re-analysing them; on iOS an old flight gets the value when it is next updated. See Compare, ranking and statistics. - Android keeps updating while the screen is open, shows “No flights yet” when empty, closes statistics when a file opens, and shows a thin import progress bar (decisions §7).